How to A/B Test Retention AI in iGaming — Slotsense
A practical A/B/C/D framework for proving incremental player value — without mistaking widget engagement for business impact.
15 mins
·
September 27, 2026
Four experimental routes, one business decision.
Retention AI is not successful because a player opens a recommendation, finishes a quiz or watches an avatar. It is successful when a pre-defined business outcome improves versus a credible control — with enough evidence to separate an incremental effect from normal variance.
Decide the primary metric, denominator, outcome window, minimum detectable effect and comparison plan before the first eligible player is assigned.
Executive summary
A rigorous iGaming experiment starts with a simple question: did access to Retention AI cause more eligible players to complete the next valuable action than the standard experience would have produced? The answer needs a valid control group, stable player-level assignment, a fixed metric hierarchy and a statistical plan that matches the A/B/C/D design.
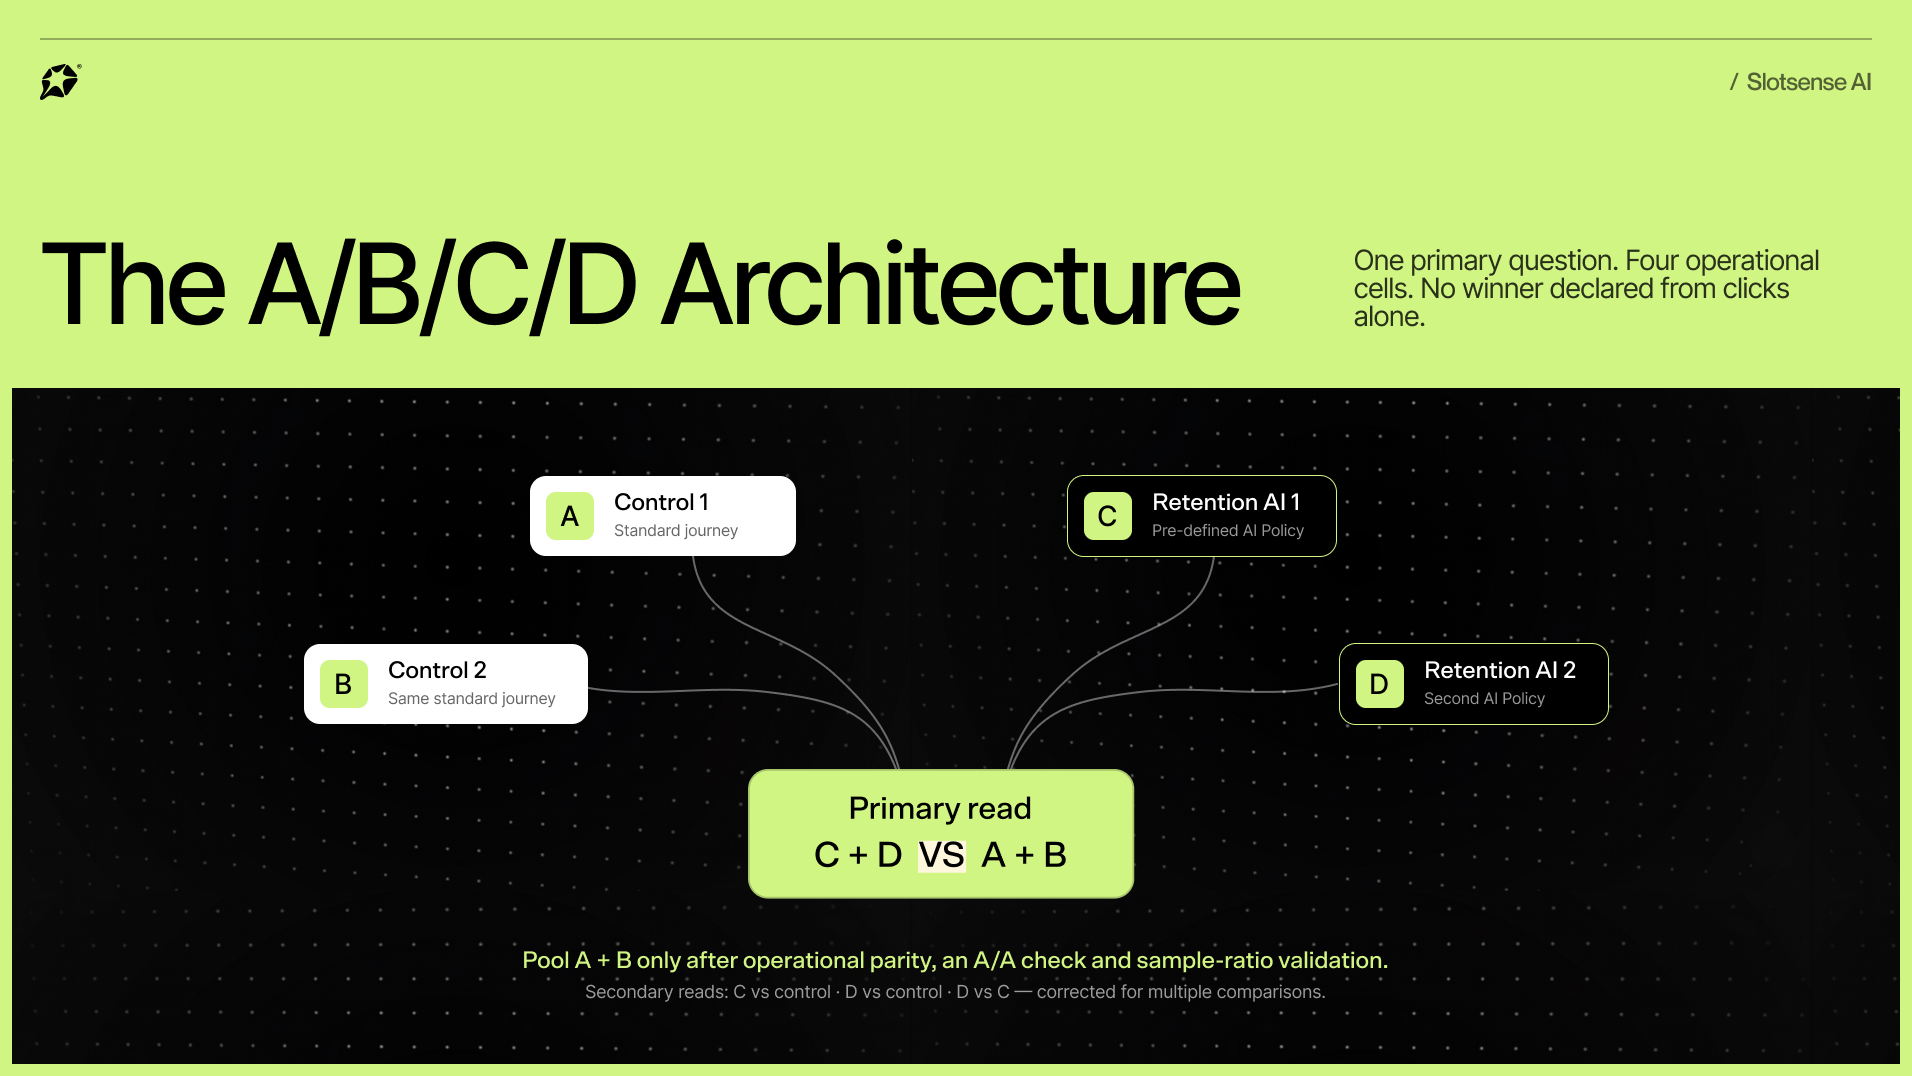
The recommended Slotsense architecture uses A and B as control cells and C and D as Retention AI variants. The primary read pools C + D against A + B, provided the two control cells are operationally and statistically compatible. Variant-level reads are secondary. This gives the experiment one clear ship decision while preserving the ability to learn which AI policy, format or action mix performs best.
Assign at player level and persist that assignment across logins, devices and repeat deposits.
Analyse all eligible assigned players in the primary read — an intention-to-treat approach.
Make one business outcome primary: for example, conversion to a real bet within 24 hours.
Treat quiz completion, recommendation opens, avatar views and message responses as diagnostics, not the definition of success.
Report raw rates, denominators, absolute lift, relative lift, 95% confidence intervals and p-values together.
Check sample-ratio mismatch, exposure coverage, A/A parity and guardrails before interpreting uplift.
1. What a Retention AI experiment should actually prove
A Retention AI test is a causal test, not a product analytics report. Product analytics tells you what users did after seeing the experience. A controlled experiment estimates what changed because the experience existed.
That distinction matters in iGaming because high-intent players are naturally more likely to engage with a quiz, open a game recommendation and place a bet. If the analysis includes only people who clicked, it will almost always make the feature look stronger than it is. Random assignment creates comparable groups; the primary analysis must preserve that comparability.
The business objective must match the moment. After a failed deposit, the objective may be friction resolution rather than a game start. After a successful first or repeat deposit, the objective may be first bet. For a returning player with known preferences, it may be re-entry into a game session. Retention AI can select the action, including no intervention, but the test must freeze what outcome counts as success.
2. The A/B/C/D architecture
Recommended A/B/C/D experiment architecture.
A rigorous Retention AI test requires an experimental design that can separate a true incremental business effect from normal variance. To achieve this, your testing setup should break players down into four distinct operational cells:
Cell A: Control 1
Role: Primary Baseline Control Group.
Player Experience: The standard player journey with absolutely no Retention AI surface or intervention applied.
Primary Analysis Role: This group is pooled with Control 2 (Cell B) after essential control validity and parity checks are completed.
Cell B: Control 2
Role: Secondary Baseline Control Group.
Player Experience: The exact same standard player journey as Cell A.
Primary Analysis Role: Used to perform an internal A/A check to ensure randomization is working correctly, before being pooled into the final aggregate control dataset.
Cell C: Retention AI Variant 1
Role: First Treatment Group.
Player Experience: The player experiences a journey where the AI dynamically selects from one pre-defined action policy or delivery route.
Primary Analysis Role: Acts as an active treatment group compared against the pooled control cells.
Cell D: Retention AI Variant 2
Role: Second Treatment Group.
Player Experience: The player experiences a journey governed by a second pre-defined policy, alternative content route, or different delivery format.
Primary Analysis Role: Acts as an active treatment group compared against the pooled control dataset, as well as a direct comparison point against Variant 1 (Cell C).
Why use two control cells?
Two control cells create an internal validity check. If A and B receive the same experience but show materially different eligibility, exposure, betting or game-start rates, do not hide the discrepancy by pooling them. Investigate assignment, instrumentation, traffic sources, market mix and delivery paths first.
A and B may be pooled only when the experience is truly equivalent and the observed differences are consistent with expected random variation. This is an A/A check, not an opportunity to choose the better-looking control after the fact.
The comparison hierarchy
1. Primary: pooled Retention AI (C + D) versus pooled control (A + B).
2. Secondary: C versus pooled control.
3. Secondary: D versus pooled control.
4. Exploratory or secondary: D versus C.
Pre-specifying this hierarchy avoids a familiar trap: running many comparisons and announcing whichever one crosses p < 0.05. If several variant comparisons may drive a decision, adjust for multiple comparisons or use a testing procedure that controls the overall false-positive rate.
3. How to select test and control groups
For readers searching how to select test and control groups, the most important answer is not “make them look similar.” It is “make assignment random, stable and independent of the outcome.” Randomisation should happen using a durable player identifier at the moment the player meets the pre-defined eligibility trigger.
To achieve this, structure your audience selection across these six core design choices:
1. Randomisation Unit
Recommended Rule: Use a stable player ID.
Why It Matters: This prevents a single user from accidentally entering more than one experimental experience.
2. Eligibility
Recommended Rule: Take a data snapshot before treatment occurs.
Why It Matters: This ensures you do not use post-treatment behaviors—which are caused by the AI itself—to decide which players count toward the analysis population.
3. Persistence
Recommended Rule: Maintain the assigned cell for the full duration of the experiment.
Why It Matters: Repeat deposits, subsequent log-ins, or new sessions must not re-randomise the player into a different group.
4. Cross-Device Identity
Recommended Rule: Resolve multi-device traffic to the same player-level assignment.
Why It Matters: This stops desktop and mobile journeys from contaminating your separate test and control groups.
5. Concurrent Tests
Recommended Rule: Enforce mutual exclusion or pre-specify an interaction analysis.
Why It Matters: This prevents overlapping features from masking, distorting, or artificially amplifying your measurement of the treatment effect.
6. Allocation
Recommended Rule: Set your traffic splits before launch and monitor rather than manually rebalancing.
Why It Matters: This preserves known, mathematically stable assignment probabilities across all cells.
If the audience is stratified by country, lifecycle stage, deposit status or VIP tier, either randomise within those strata or pre-specify adjusted analysis. Do not create the strata after seeing results. Report inclusion and exclusion rules so that the result can be reproduced and its scope is clear.
A 25/25/25/25 split is analytically clean when every cell needs an adequate sample. A smaller treatment holdout can be appropriate when risk or supply is constrained, but unequal allocation reduces precision for the same total sample. The workbook supplied with this article plans the pooled control-versus-treatment comparison; specialised designs may need simulation.
4. What Retention AI may change — and what must stay fixed
Retention AI exists to choose the next action most likely to achieve a defined objective for the current player context. That creates more degrees of freedom than a conventional banner test. The solution is not to remove intelligence from the treatment. It is to define the decision envelope before launch.
AI may change
Action type: quiz, personalised game recommendation, randomizer, contextual message, AI avatar, support guidance or wait.
Timing: immediate, delayed or suppressed within a pre-defined policy.
Content: language, tone, explanation and recommended game, within approved content rules.
Delivery surface: an approved player-facing format or placement.
Recommendation recovery: what happens after the player ignores, dismisses or rejects an option.
The experiment must hold fixed
Eligibility trigger and analysis population.
Primary objective, metric definition and outcome window.
Allowed action library, commercial and regulatory restrictions, and suppression rules.
Experiment allocation and persistence logic.
Event schema: assignment, eligibility, exposure, action, reason, interaction and outcome.
Model or policy version unless a change is explicitly part of the treatment design.
“Do nothing” can be a legitimate next best action. If the AI suppresses low-value or poorly timed interactions, log the decision and its reason. Do not treat non-exposure as a delivery failure when it is an intentional policy outcome; distinguish technical non-delivery from purposeful waiting.
5. Choose a metric hierarchy before launch
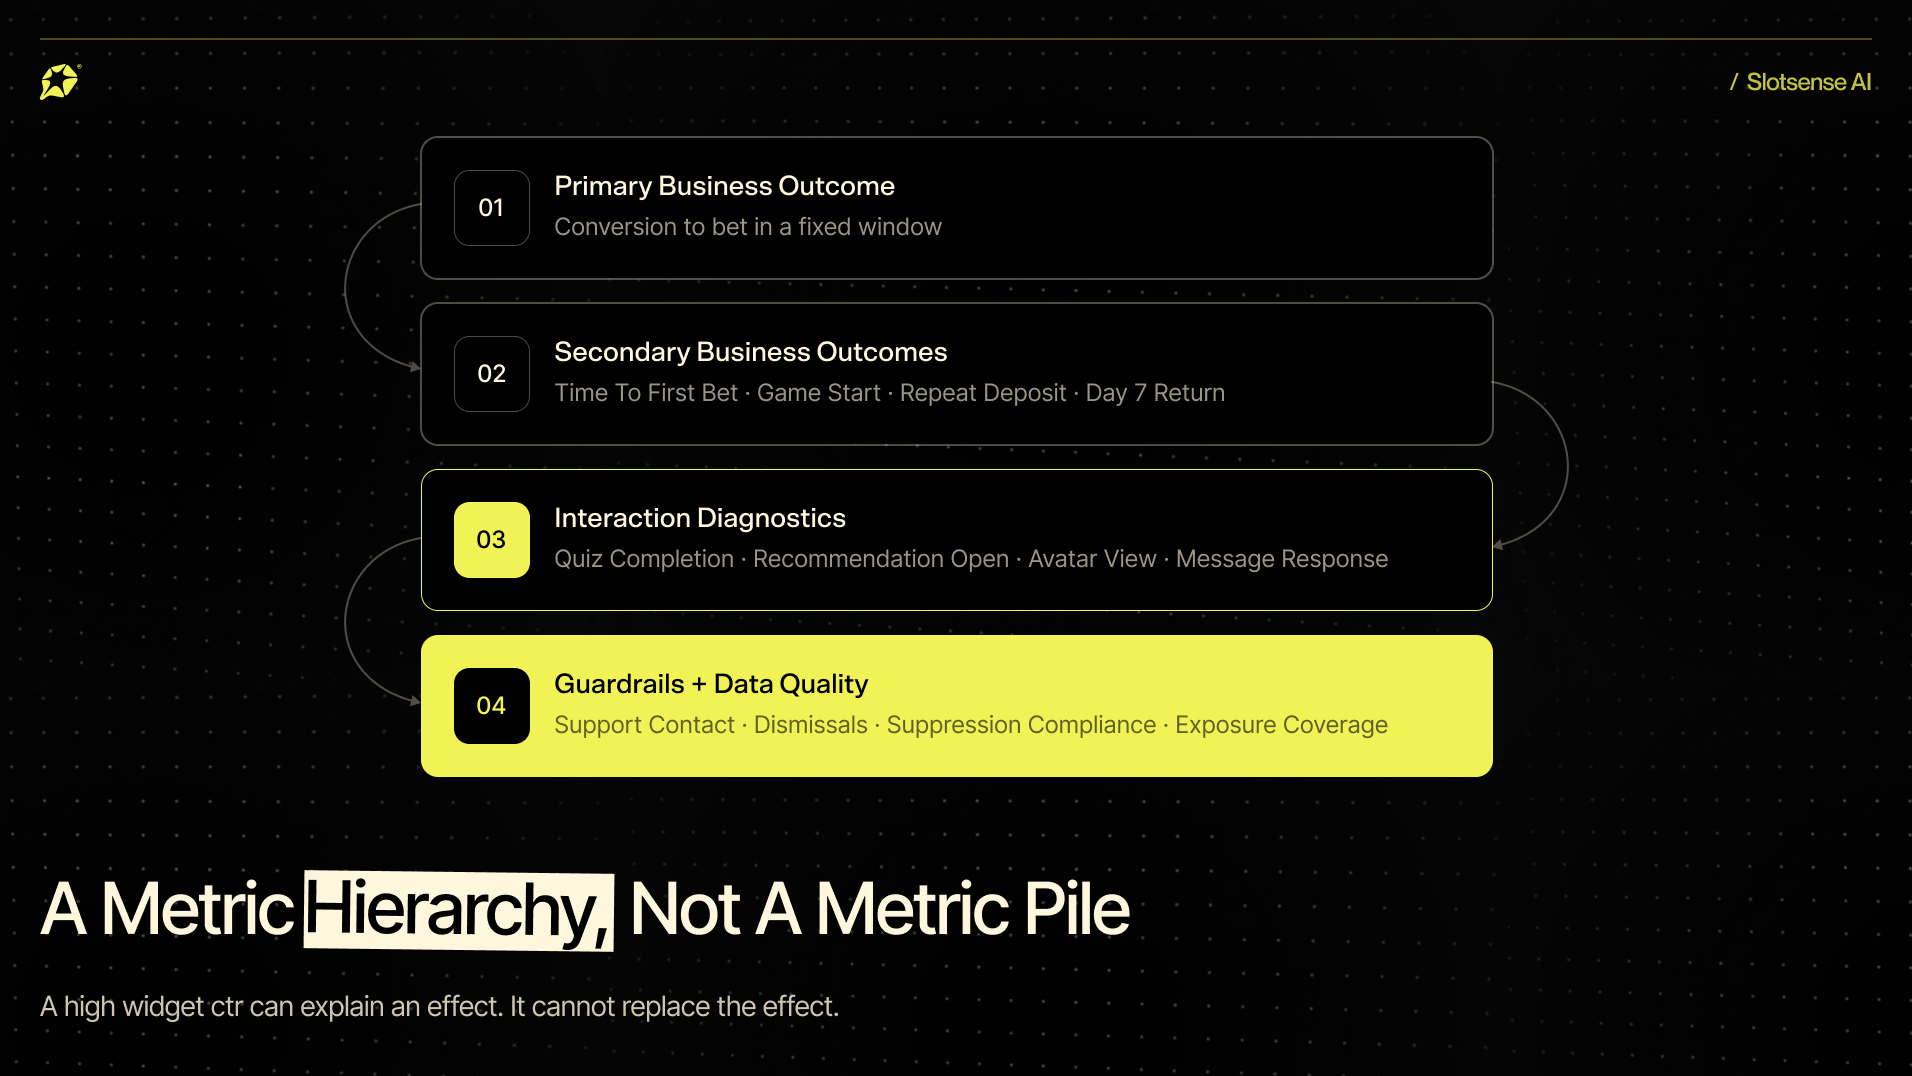
A practical metric hierarchy for Retention AI experiments.
Primary metric
Choose one metric that directly answers the ship question. For a post-deposit “Lead to Bet” journey, a strong default is the proportion of eligible assigned players who place at least one real bet within 24 hours of the qualifying trigger.
Primary conversion = players with the qualifying outcome ÷ eligible assigned players. The denominator is not exposed users, quiz starters or recommendation openers. Those groups are created after assignment and are therefore post-treatment subsets.
Secondary business metrics
Conversion to bet within 15 minutes or one hour, to measure speed of activation.
Time from trigger to first bet, reported with a distribution or median rather than only a mean.
Game start within a fixed window, especially when the objective is discovery rather than wagering.
First-bet amount, number of bets and total stake, interpreted with care because these metrics are highly skewed.
Repeat deposit and Day 7 or Day 21 return, as downstream value indicators.
Support contact or unresolved friction, when the intervention is intended to prevent or resolve a problem.
Interaction metrics
Quiz completion, randomizer use, recommendation open, avatar view and message response explain how the experience worked. They are valuable for creative and product optimisation. They are not substitutes for incremental business lift.
Guardrails and data-quality metrics
Track dismissals, support contacts, suppression compliance, exposure logging coverage, latency, model errors and responsible-gambling rules. A treatment should not ship because the primary rate improved if the experience created unacceptable friction or violated intervention policies.
6. Deposits: trigger, outcome or downstream signal?
Deposits are often mishandled in retention reporting because the same event can play different roles in different experiments. To avoid claiming a trigger event as an artificial lift, you must categorize your deposit metrics based on three specific experiment entry points:
1. When the Experiment Starts Before the Deposit
The Role of the Qualifying Deposit: It is a possible outcome of the treatment.
The Appropriate Deposit Metric: Measure deposit conversion rates within a strictly fixed observation window.
2. When the Experiment Starts Immediately After a Successful Deposit
The Role of the Qualifying Deposit: It acts as an eligibility trigger, not an outcome. Because the player has already deposited before entering the experiment, the treatment could not have caused that specific event.
The Appropriate Deposit Metric: Track repeat deposits or later downstream deposit values instead of the initial trigger event.
3. When the Experiment Starts After a Failed Deposit
The Role of the Qualifying Deposit: It is a friction signal indicating that the player's journey has hit a roadblock.
The Appropriate Deposit Metric: Measure successful deposit recovery rates first, followed by downstream game starts or betting outcomes.
7. Avoid “widget CTR = success”
A widget can have a high click-through rate and produce no incremental bets. It can also have a modest interaction rate yet materially improve outcomes by helping the right players at the right moment. This is why the treatment is assignment to a decision policy, not merely exposure to a visual component.
Three common errors inflate product results:
1. Dividing outcomes by engaged users instead of all eligible assigned users.
2. Comparing exposed treatment users with all control users when exposure is conditional on behaviour.
3. Reporting the best interaction event as the experiment’s success metric after seeing the data.
The correct primary read is intention-to-treat: compare groups based on assignment. Exposure-based and engagement-based analyses can appear alongside it, clearly labelled as diagnostic. If the experience is not delivered reliably, that lowers the measured treatment effect — and correctly reflects the impact of the full production system.
8. Incremental uplift: show the maths buyers can understand
A credible experiment result should clearly distinguish between absolute and relative improvements to avoid ambiguity. When communicating your test results to stakeholders, break your performance data down into these three core financial and mathematical measures:
1. Absolute Lift
The Formula: p₁ - p₀ (where p₁ is the treatment rate and p₀ is the control rate).
How to Say It: Report this figure as a percentage-point change. For example, if your control conversion rate is 8% and the treatment rate is 10%, the absolute lift is 2 percentage points.
2. Relative Lift
The Formula: (p₁ - p₀) ÷ p₀
How to Say It: Report this figure as a percent improvement versus control. Using the same 8% to 10% example, this represents a 25% relative improvement. Always explicitly specify "percentage points" or "relative percent" to keep your data transparent.
3. Incremental Conversions
The Formula: (p₁ - p₀) × eligible treatment users
How to Say It: Report this figure as the estimated additional outcomes at your observed scale. This is the metric that commercial buyers value most, as it allows teams to multiply incremental outcomes by an agreed financial value per action to model true commercial return.
If control is 8% and treatment is 10%, the absolute lift is 2 percentage points and the relative lift is 25%. Saying “2% uplift” is ambiguous; always specify percentage points or relative percent.
For commercial modelling, scale the absolute lift by the eligible population, then apply an agreed value per incremental outcome. Keep this financial extrapolation separate from the experiment estimate and show the assumptions.
9. Attribution: count outcomes consistently
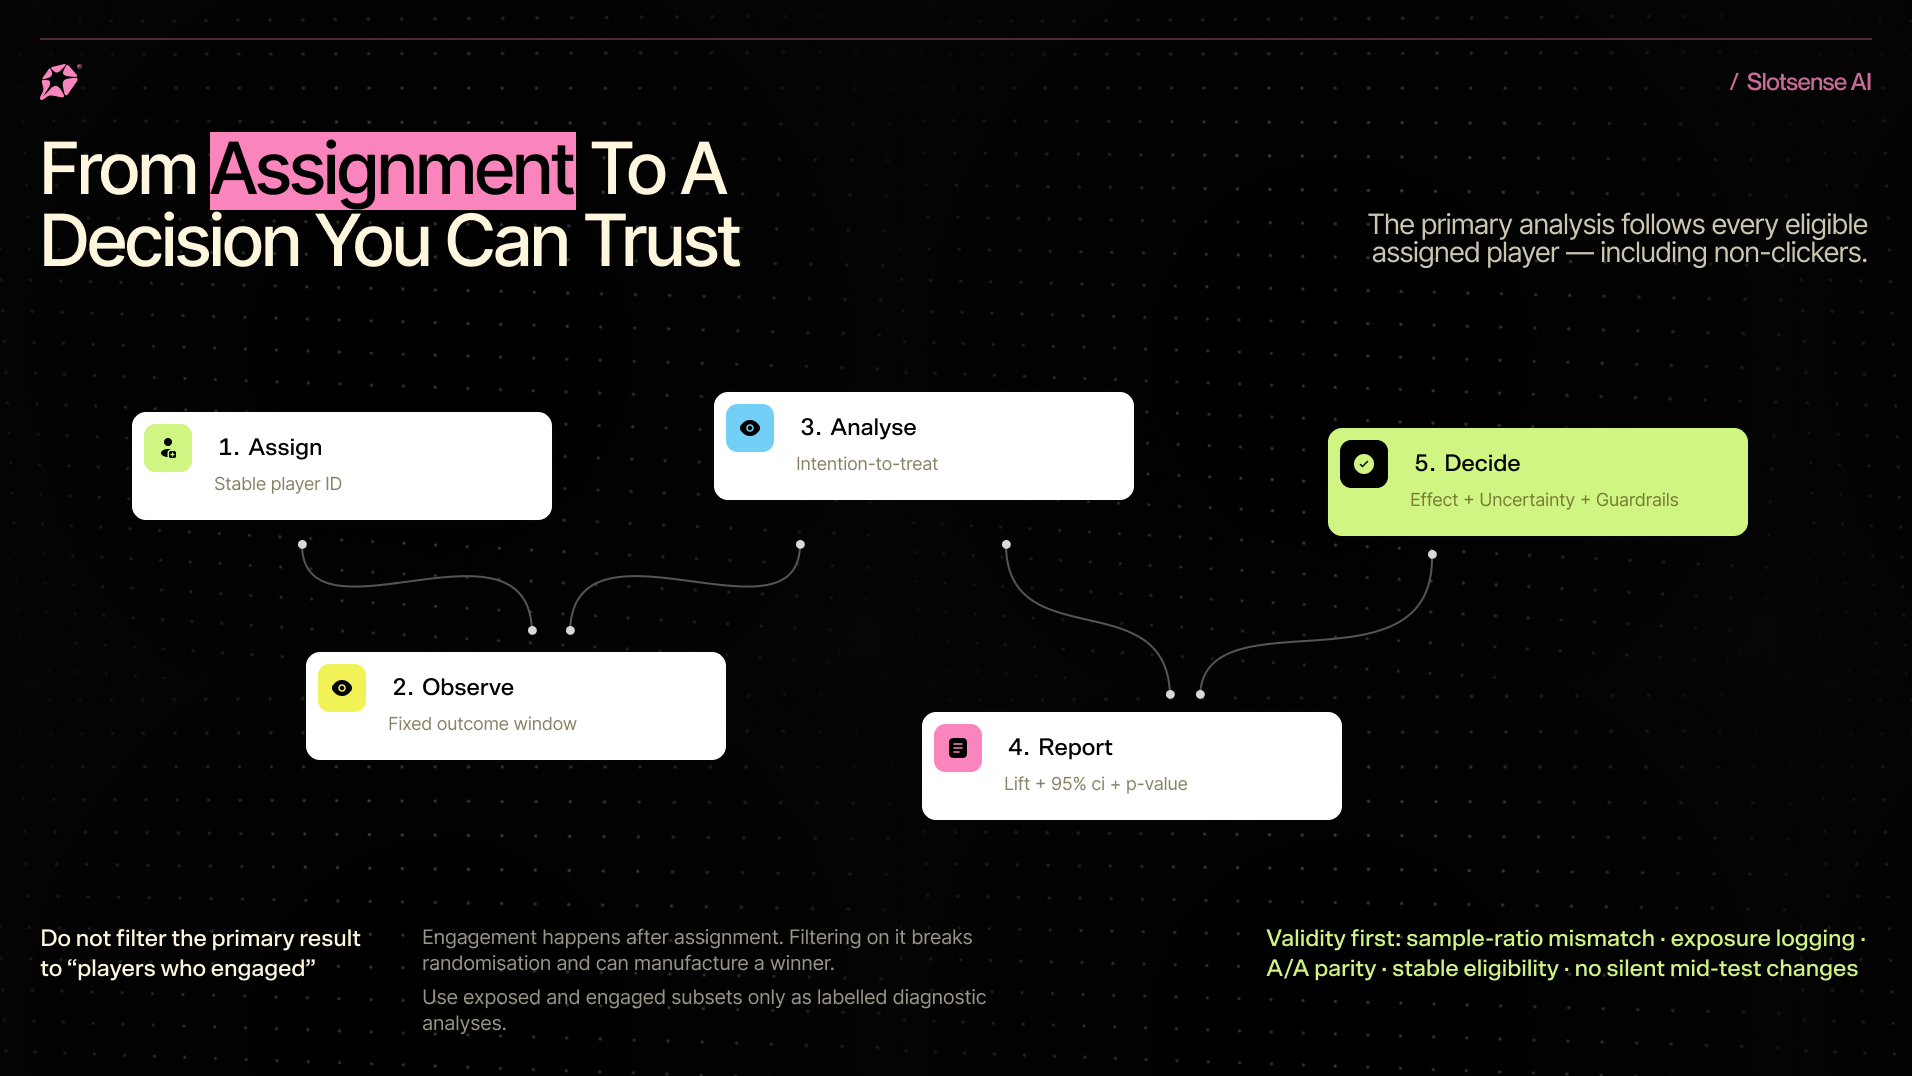
The analysis path from random assignment to a decision.
Attribution should be rule-based, not narrative. A player counts as converted if the qualifying outcome occurs after the trigger and within the pre-defined window, regardless of whether the player clicked the Retention AI surface or selected the recommended game.
Attribution should be rule-based, not narrative. A player counts as converted if the qualifying outcome occurs after the trigger and within the pre-defined window, regardless of whether the player clicked the Retention AI surface or selected the recommended game.
That last point is important. If the objective is to lead to a bet, a bet in a different game is still a successful outcome. The recommendation may have reduced search friction or prompted activity without directly receiving the final click. Record whether the bet happened in the recommended game as a secondary diagnostic, not as the only valid conversion.
Minimum event record
player_id or privacy-safe experiment identity;
experiment_id, group and assignment timestamp;
eligibility trigger and qualifying context;
AI policy/model version and available action set;
selected action, reason and intentional “wait” decision;
delivered exposure and delivery failure status;
interaction events;
outcome event, value and elapsed time from trigger.
Resolve late-arriving events and cross-device outcomes consistently. Freeze the data cutoff only after every player in the analysis has had the full outcome window. A user assigned near the end of the run still needs the same 24-hour or seven-day observation opportunity as a user assigned on day one.
10. Measuring statistical significance in marketing experiments
Measuring statistical significance in marketing is not a ritual performed after the dashboard looks positive. It begins with sample-size planning and a minimum detectable effect: the smallest difference worth detecting and acting on.
Plan baseline, MDE, alpha and power
Baseline rate: use recent data from the exact eligible population and the same outcome definition.
Minimum detectable effect (MDE): define the smallest absolute or relative lift that changes a business decision.
Significance level (alpha): 0.05 is common for a two-sided test, but it is a choice, not a law.
Power: 80% is a common planning default — the probability of detecting the MDE if it is real.
Duration: run long enough to reach the planned sample and cover at least one complete behavioural cycle; do not stop at the first attractive daily read.
The framework includes a transparent fixed-horizon two-proportion sample-size calculator. For low event counts, unequal allocations, repeated measures, sequential designs or cluster effects, use an exact, simulation-based or specialist method.
Read confidence intervals and p-values together
A p-value describes how incompatible the observed data are with a specified statistical model under the null hypothesis. It does not measure the size of the effect, the probability that the hypothesis is true or the commercial importance of the result. The American Statistical Association explicitly cautions against basing decisions on whether a p-value crosses a threshold alone.
A 95% confidence interval around the absolute lift shows the range of effects compatible with the data under the model. Compare that range with the MDE and with the cost or risk of shipping. A narrow interval around a trivial effect can be statistically significant but commercially uninteresting. A promising lift with a wide interval is a signal to gather more evidence, not proof.
Handle multiple comparisons and peeking
With one primary pooled comparison, alpha can be reserved for the question that matters most. C-versus-control, D-versus-control and D-versus-C reads should be labelled secondary and adjusted if they will be used to select a winner. Bonferroni or Holm corrections are simple options; more efficient procedures may be appropriate with a pre-defined hierarchy.
Repeatedly checking a conventional fixed-horizon p-value and stopping when it becomes significant inflates false positives. Either commit to the planned sample and analysis date or use a valid sequential-testing method with appropriate monitoring boundaries. Do not change the model, action library, allocation or eligibility rules mid-test without treating that change as a new experiment or a pre-specified phase.
11. Statistical significance is not the business decision
Statistical significance is not a ritual performed after a dashboard looks positive; it is a framework for making clear business decisions. When your experiment concludes, your confidence intervals (CI), primary lift metrics, and guardrail health will fall into one of six distinct operational patterns:
1. Clear Winning Signal
Observed Pattern: Positive lift, the confidence interval completely excludes zero, and all guardrails remain healthy.
What It Means: You have strong evidence of a true incremental effect under the current experiment design.
Recommended Response: Assess whether the observed effect meets your pre-defined Minimum Detectable Effect (MDE) and determine if the treatment is operationally scalable.
2. Inconclusive Trend
Observed Pattern: Positive lift, but a wide confidence interval crosses over zero.
What It Means: The result is promising but statistically inconclusive due to insufficient data or high variance.
Recommended Response: Continue running the experiment until you reach your planned sample size, or launch a new, highly focused confirmatory test.
3. Flatline Result
Observed Pattern: Near-zero lift accompanied by a narrow confidence interval.
What It Means: The treatment is highly unlikely to deliver a meaningful business effect at this current scale.
Recommended Response: Stop the current experiment or completely redesign the underlying decision policy.
4. Indirect Impact
Observed Pattern: Positive overall business lift, but interaction metrics (like click-through rates) remain low.
What It Means: The policy may be helping a small but highly valuable subset of players, or it is prompting action indirectly without capturing the final click.
Recommended Response: Investigate the player paths to understand the behavior, but do not redefine or alter your primary success metric.
5. Engagement Trap
Observed Pattern: High widget click-through rate (CTR), but zero business lift.
What It Means: Players are actively interacting with the new visual component, but the experience is simply cannibalizing natural behavior and not creating incremental value.
Recommended Response: Optimize the underlying objective and action logic instead of just tweaking the creative assets or design.
6. Guardrail Breach
Observed Pattern: Any level of positive uplift paired with a failure in your guardrail metrics.
What It Means: The measured business effect is unsafe or operationally unacceptable (e.g., causing a spike in support tickets or violating responsible-gambling rules).
Recommended Response: Do not ship the feature under any circumstances until the underlying operational issue is fully resolved.
12. Validity checks before reading the result
Microsoft experimentation research recommends checking sample-ratio mismatch before other analyses. A sample-ratio mismatch (SRM) occurs when the observed assignment counts differ more than expected from the planned allocation. It can signal broken randomisation, missing telemetry, inconsistent eligibility or delivery problems, and can invalidate the test.
Compare observed and planned group counts with an SRM test.
Check eligibility, assignment and exposure volumes by day and by group.
Confirm A and B delivered the same control journey and produce compatible results.
Audit missing outcomes and late events; verify that every group receives the full observation window.
Confirm exposure logging coverage and distinguish intentional “wait” decisions from technical failure.
Review market, device, lifecycle and traffic-source balance without cherry-picking subgroups.
Verify that no unplanned prompt, model, UI, bonus or CRM change occurred unevenly across cells.
Review responsible-gambling and customer-interaction suppressions before publishing or shipping.
13. Common failure modes in Retention AI tests
Running an experiment with dynamic Retention AI involves more moving parts than a static banner test. To keep your results clean and trustworthy, you must protect your data against eight common failure modes that can quietly corrupt your analysis:
1. Unstable Control Environment
The Failure Mode: The control group's experience changes mid-run.
Why It Breaks the Read: Your baseline counterfactual is no longer stable, making it impossible to tell what caused the change in player behavior.
The Fix: Strictly version your player experiences. If a change is necessary, restart the test entirely or analyze the data in clearly pre-defined, distinct phases.
2. Re-Randomisation Loops
The Failure Mode: A player gets re-randomised into a different group every time they make a new deposit or log in.
Why It Breaks the Read: The same individual contaminates multiple experimental cells, which dilutes your tracking data and destroys group isolation.
The Fix: Persist all group assignments strictly at the individual player account level across all sessions, devices, and deposits.
3. Post-Treatment Selection Bias
The Failure Mode: The analysis looks only at "exposed" or "engaged" treatment users rather than everyone who was assigned.
Why It Breaks the Read: Actual exposure is heavily influenced by the AI's delivery mechanics and live user behavior. Filtering your data this way destroys the random comparability of your groups.
The Fix: Keep an Intention-to-Treat (ITT) approach as your primary read by analyzing all eligible assigned players. Use exposed or engaged subsets purely as secondary diagnostics.
4. The Engagement Trap
The Failure Mode: Choosing click-through rate (CTR) or widget interaction as the ultimate metric of success.
Why It Breaks the Read: It measures a user's reaction to a visual element rather than incremental business value. High engagement does not automatically equal new revenue.
The Fix: Establish a fixed, down-funnel business outcome (such as a real money bet within 24 hours) as your primary success metric.
5. Backwards Timeline Attribution
The Failure Mode: Counting a qualifying deposit as a success outcome after a post-deposit trigger has already fired.
Why It Breaks the Read: This mistakenly claims a past event—which occurred before the treatment even happened—as a direct result of the AI.
The Fix: Measure the very next logical business action (like a game start or first bet) and relegate subsequent deposits to downstream tracking.
6. Multi-Metric Fishing
The Failure Mode: Tracking dozens of metrics simultaneously without setting a clear hierarchy before launch.
Why It Breaks the Read: A chance statistical fluctuation in a random metric can easily be misidentified and promoted as a deliberate success.
The Fix: Pre-specify exactly one primary success metric and outline a strict correction plan for any secondary comparisons.
7. Premature Data Peeking
The Failure Mode: Stopping the experiment early simply because a single day's dashboard showed a positive spike.
Why It Breaks the Read: Optional stopping dramatically inflates your false-positive rates due to normal daily variance.
The Fix: Commit to a fixed-horizon timeline based on a planned sample size, or implement valid sequential-testing methodologies with clear statistical boundaries.
8. Blind Control Pooling
The Failure Mode: Combining data from Control Cells A and B without checking their underlying compatibility.
Why It Breaks the Read: A broken tracking script, random assignment error, or hidden bug in one control cell will distort your baseline and invalidate the test.
The Fix: Always run comprehensive parity and Sample-Ratio Mismatch (SRM) checks on your control cells before pooling them together for the final analysis.
Frequently asked questions
What is a control group in marketing?
A control group is the randomly assigned audience that does not receive the treatment being evaluated. In a Retention AI experiment, the control represents the standard player journey. Its outcome rate estimates what would have happened without Retention AI during the same period.
How do you select test and control groups?
Use stable player-level random assignment after a player meets pre-defined eligibility. Persist the assignment, use the same observation window in every group and prevent cross-device or repeat-visit contamination. Similar-looking groups created manually are not a substitute for randomisation.
Can A and B control groups be combined?
Yes, if both cells received the same experience and pass operational parity, sample-ratio and A/A compatibility checks. Decide the pooling rule before inspecting treatment outcomes.
What should the primary metric be?
Choose the single business outcome that matches the objective and trigger. For a successful post-deposit Lead to Bet journey, conversion to a real bet within 24 hours is usually stronger than quiz completion or recommendation CTR.
What does statistical significance mean in marketing?
It indicates how incompatible the observed result is with a specified null model, given the test assumptions. It does not tell you the probability that the treatment works, the size of the effect or whether the result is commercially important. Report the effect and confidence interval with the p-value.
Should Retention AI be judged only on players who engaged?
No. Engagement occurs after assignment and is influenced by the treatment. The primary result should include all eligible assigned users. Engaged-user analysis is useful only as a labelled diagnostic view.

.png)
.png)